Key Takeaways
- The Performance Schema is a gold mine for finding querying to optimize becuase it allows us to collecting the necessary data to make educated decisions.
- Normally ony a few queries are responsible for most of the load on the system. Checking to the top 1000 queries it’s usually not worth your time to optimize.
- UPDATE and DELETE statements are still reads even though they are write statements. This will have an impact on I/O and therefore to response time.
Sources of Information
When we encounter a performance problem, the first step is to determine what is causing it.
Our goal is to reduce the response time, and therefore we need to understand why the server requires a certain amount of time to respond to a query, and reduce or eliminate whatever unnecessary work it’s doing to achieve the result. In other words, we need to measure where the time goes.
This leads to an important principle of optimization: we cannot reliably optimize what we cannot measure. Our first job is therefore to measure where time is spent.
MySQL offers a large set of system views that allows administrators, and developers alike to take a deeper look into what is really going on, into their system.
There is no way, to improve performance and reliability, without first collecting the necessary data. Afterward, we could make educated decisions, based on facts. However, the challenge is to really make sense, out of this plethora of metrics.
use performance_schema;
show tables;
Therefore the objective in this section is to make use of MySQL statistics, and make it easier for people to take advantage of their insights.
The Performance Schema is a gold mine for information about the performance of your queries. These tables will allow you to get very detailed information about the queries that are executing on the instance.
The table most often used is events_statements_summary_by_digest, and it is essentially a report of all the queries that have been executed on the instance, since the table was last reset (normally when restarting MySQL).
The essentials ones are:
- DIGEST_TEXT The normalized query. For example:
SELECT * FROM city WHERE name = 'London' will be transformed in SELECT * FROM city WHERE ID = ?- COUNT_STAR shows The number of times the query has been executed.
- SUM_TIMER_WAIT The total amount of time that has been spent executing the query. Note that the value flows over after a little more than 30 weeks of execution time.
- SUM_LOCK_TIME The total amount of time that has been spent waiting for table locks.
As you can see from the list of columns, there are might be many opportunities to find queries for optimisation. The trick is to query for the things that are important. What qualifies as important also depends on your situation. For example, if you know from your monitoring that there are problems with a large number of internal temporary tables using memory or disk, then the SUM_CREATED_TMP_DISK_TABLES and SUM_CREATED_TMP_TABLES columns are good candidates for filtering.
However, a good place to start is always the Top 10 time-consuming Queries.
Top 10 Time-Consuming Queries
Using a simple SELECT on this view won’t be really helpful. There could be a lot of queries executed on a server. Therefore, when you’ll use this view always create a sorted output so that the most relevant information can be seen instantly.
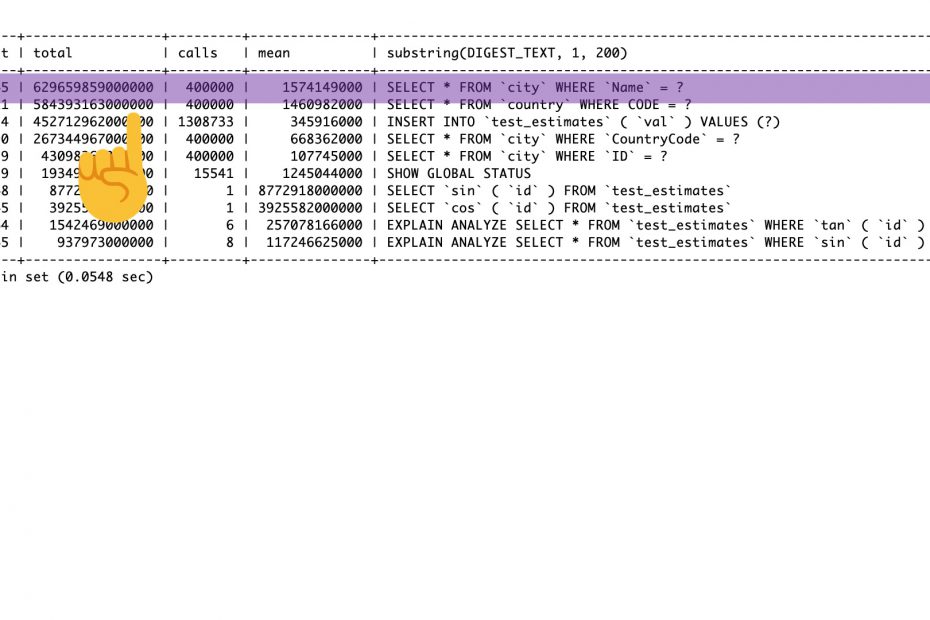
SELECT (100 * SUM_TIMER_WAIT / sum(SUM_TIMER_WAIT)
            OVER ()) percent,
            SUM_TIMER_WAIT AS total,
            COUNT_STAR AS calls,
            AVG_TIMER_WAIT AS mean,
            substring(DIGEST_TEXT, 1, 200)
  FROM  performance_schema.events_statements_summary_by_digest
            ORDER BY SUM_TIMER_WAIT DESC
            LIMIT 10;
Each row shows the response time as a total, and as a percent of the overall total, the number of times the query executed, the average response time per query, and an abstraction of the query.
This shows the top 10 queries, ordered by total time consumed, and makes it clear how expensive each of these types of queries is, relative to each other as well as to the whole.
Checking to the top 1000 queries it’s usually not worth your time to optimize, because they contribute a very small portion of response time overall.
Normally the first queries are responsible for most of the load on the system.
Next, we could check the average time for execution one query, so that we can recognise if the runtime for those queries it’s higher than expected.
Still, the output is not really readable for a human, since the measurements are in picoseconds. This formatted version of the events_statements_summary_by_digest table, already ordered by the total latency in descending order, is called statement_analysis and its part of the sys schema. The downside is that we can’t really change this view.
SELECT *
        FROM sys.statement_analysis
        LIMIT 10\G;
In practice, when execution-time profiling shows that a task is responsible for a lot of elapsed time, you might be able to drill into it and find that some of the “execution time” is spent waiting, at some lower level. For example, if a lot of time is consumed by a SELECT against a table, but at a lower level, that time might be spent waiting for I/O to complete.
One important thing to note, is that queries executed as prepared statements are not included in the statement tables. Instead, you need to use the prepared_statements_instances table. However, the same principles applies there as well.
As usual, although the profile helps us identify what types of activity contribute the most to the elapsed time, it doesn’t tell us why. To find out why it took so much time to copy data into the temporary table, we’d have to drill down into that state and produce a profile of the subtasks it executed.
Why Are Queries Slow?
Queries are tasks, and they are composed of subtasks, and those subtasks consume time. To optimize a query, we must optimize its subtasks by eliminating them, making them happen fewer times, or making them happen more quickly.
In general, you can think of a query’s lifetime by mentally following the query through its sequence diagram from the client to the server, where it is parsed, planned, and executed, and then back again to the client. Execution is one of the most important stages in a query’s lifetime. It involves lots of calls to the storage engine to retrieve rows, as well as post-retrieval operations such as grouping and sorting.
While accomplishing all these tasks, the query spends time on the network, in the CPU, in operations such as statistics and planning, locking (mutex waits), and most especially, calls to the storage engine to retrieve rows. These calls consume time in memory operations, CPU operations, and especially I/O operations if the data isn’t in memory.
In every case, excessive time may be consumed because the operations are performed needlessly, performed too many times, or are too slow. The goal of optimization is to avoid that, by eliminating or reducing operations, or making them faster.
Next, we’ll see what other situations are there? that that are common candidates for optimisation.
Making use of Performance Schema
Going back to the events_statements_summary_by_digest table.
SELECT *
        FROM performance_schema.events_statements_summary_by_digest
        ORDER BY SUM_TIMER_WAIT DESC
        LIMIT 10\G;
Let’s see some examples of some conditions that justify further investigation include:
- SUM_ROWS_SENT vs SUM_ROWS_EXAMINED. Large amount of examined rows compared to the number of rows sent back to the client or that are modified. This may suggest poor index usage.
- SUM_SELECT_FULL_JOIN. If the number of full joins is high. This suggests that, either an index is needed, or there is a join condition missing. A full table scan will occur when there is no index for the join condition or there is no join condition.
- SUM_SELECT_RANGE_CHECK. If the number of range checks is high. This may suggest that you need to change the indexes on the tables in the query. When a secondary index its used but the range scan includes a large part of the table, using a secondary index can end up being more expensive than performing a full table scan.
- SUM_CREATED_TMP_TABLES. If the number of internal temporary tables created in disk is high. This may suggest that you need to consider which indexes are used for sorting and grouping, and the amount of memory allowed to internal temporary tables. Writing on disk is still more expensive than internal memory.
- The number of sort merges is high. This may suggest this query can benefit from a larger sort buffer.
Still, as mention earlier, what metrics qualifies as important also depends on your situation.
Usually, these views are used in combination of other views and tables. For example, you may detect that the CPU usage is very high. A typical cause of high CPU usage is large table scans, so you may look at the schema_tables_with_full_table_scans view and find that one or more tables are returning a large number of rows through table scans. Then go on to query the statements_with_full_table_scans view to find statements using that table without using indexes.
Table I/O and File I/O
The I/O performance is vital for MySQL databases. Data is read and written to the disk in numerous places. Redo logs, tablespaces, binary and relay logs.
An increase in I/O count or latencies measured from the Performance Schema is neither a good nor a bad thing on its own. However, if you identified a certain problem. For example, if you determined that the disk I/O is a bottleneck becuase the disks are 100% utilized or that end users report the system is slow, then use Table I/O and File I/O views to determine what is causing the the increase in I/O.
We can then work backward to find the tables involved. From there we may determine we can optimize queries using the tables or that you need to increase the I/O capacity.
There are multiple Performance Schema tables that include latency statistics for the table I/O, out of which table_io_waits_summary_by_index_usage can be particularly useful.
SELECT OBJECT_TYPE, OBJECT_SCHEMA,
              OBJECT_NAME, INDEX_NAME,
              COUNT_STAR
         FROM performance_schema.table_io_waits_summary_by_index_usage
        WHERE OBJECT_SCHEMA = 'world'
              AND OBJECT_NAME = 'city'\G
∗∗∗∗∗∗∗∗∗∗∗∗∗∗∗∗∗∗∗∗∗∗∗∗∗∗∗ 1. row ∗∗∗∗∗∗∗∗∗∗∗∗∗∗∗∗∗∗∗∗∗∗∗∗∗∗∗
OBJECT_TYPE: TABLE
OBJECT_SCHEMA: world
OBJECT_NAME: city
INDEX_NAME: PRIMARY
COUNT_STAR: 20004
∗∗∗∗∗∗∗∗∗∗∗∗∗∗∗∗∗∗∗∗∗∗∗∗∗∗∗ 2. row ∗∗∗∗∗∗∗∗∗∗∗∗∗∗∗∗∗∗∗∗∗∗∗∗∗∗∗
OBJECT_TYPE: TABLE
OBJECT_SCHEMA: world
OBJECT_NAME: city
INDEX_NAME: CountryCode
COUNT_STAR: 549000
∗∗∗∗∗∗∗∗∗∗∗∗∗∗∗∗∗∗∗∗∗∗∗∗∗∗∗ 3. row ∗∗∗∗∗∗∗∗∗∗∗∗∗∗∗∗∗∗∗∗∗∗∗∗∗∗∗
OBJECT_TYPE: TABLE
OBJECT_SCHEMA: world
OBJECT_NAME: city
INDEX_NAME: NULL
COUNT_STAR: 417489729Using the query above we can see how many times an index has been used or not for a specific table.
This example shows the two indexes on the city table as well as the NULL index, which means that no index was used. Consider the three values of COUNT_STAR. If you sum those, we get the same value of total read for that tables.
Here the read made with an index are insignificant compared to the reads made without an index.
It is useful to take a minute to consider when the fetch, insert, update, and delete counters increase and for which indexes. Consider the world.city table which has a primary key in the ID column and a secondary index on the CountryCode column . This means you can set up three types of filters depending on the index that is used or lack thereof.
- By Primary Key:
- By Secondary Index.
- By No Index
Secondary indexes are simply those that are not for the primary key.
Consider how many rows are fetched for each of the three example using WHERE clauses with a SELECT, UPDATE, or DELETE statement as well as executing an INSERT statement. The INSERT statement does not have a WHERE clause, so it is a little different. For each affected index, the number of reads and writes is listed. The Rows column shows the number of rows returned or affected for each statement.
| Query/Index | Rows | Reads | Writes |
|---|---|---|---|
| SELECT by primary key PRIMARY | 1 | FETCH: 1 | |
| SELECT by secondary index CountryCode | 14 | FETCH: 14 | |
| SELECT by no index NULL | 1 | FETCH: 4079 | |
| UPDATE by primary key PRIMARY | 1 | FETCH: 1 | UPDATE: 1 |
| UPDATE by secondary index CountryCode | 14 | FETCH: 15 | UPDATE: 14 |
| UPDATE by no index NULL | 1 | FETCH: 4080 | UPDATE: 1 |
| DELETE by primary key PRIMARY | 1 | FETCH: 1 | DELETE: 1 |
| DELETE by secondary index CountryCode | 14 | FETCH: 15 | DELETE: 14 |
| DELETE by no index NULL | 1 | FETCH: 4080 | DELETE: 1 |
| INSERT NULL | 1 | INSERT: 1 |
A key takeaway from the table is that for UPDATE and DELETE statements, there are still reads even though they are write statements. The reason is that the rows still must be located before they can be changed. Another observation is that when using the secondary index or no index for updating or deleting rows, then many more records are read than updated.
The Error Summary Tables
While errors are not directly related to query tuning, an error does suggest something is going wrong. A query resulting in an error will still be using resources, but when the error occurs, it will be all in vain. So indirectly errors affect the query performance by adding unnecessary load to the system. There are also errors that are more directly related to the performance such as errors caused by failure to obtain locks.
There are five tables in the Performance Schema grouping the errors encountered by different groupings. The tables are:
- events_errors_summary_by_account_by_error
- events_errors_summary_by_host_by_error
- events_errors_summary_by_thread_by_error
- events_errors_summary_by_user_by_error
- events_errors_summary_global_by_error
Summary
This chapter has explored the sources available to find queries that are candidates to be optimized.
We started out going through the Performance Schema and considered which information is available and which is most relevant.
Particularly the events_statements_summary_by_digest table is a gold mine when looking for queries that may have performance issues. You should however not restrict yourself to just looking at queries. You should also take table and file I/O into consideration as well as whether queries cause errors. These errors may include lock wait timeouts and deadlocks.
Bibliography
- MySQL 8 Query Performance Tuning, Jesper Wisborg Krogh, Apress, March 2020
- High Performance MySQL, 3rd Edition, Baron Schwartz, Peter Zaitsev, Vadim Tkachenko, O’Reilly Media, Inc., March 2012