Key takeaways
- The default values in the server configuration file have small memory settings. You should carefully modify primary memory configurations, shared_buffers and work_mem, in unison to make sure your system doesn’t run out of memory altogether.
- The query planner needs to know about the memory situation and have good table statistics in order to make accurate plans.
- The autovacuum process is essential to make sure the query planner has the right information to work with, as well as to keep tables maintained properly.
- In many cases, you can adjust parameters without a server restart. You can also adjust many parameters on a per-client basis for really fine-tuning.
This section is not intended to describe the meaning of every parameter. It’s rather focused on guidelines for setting the most important values. The purpose of the guide is for someone interested in performance tuning.
Understanding the context of the configurations
There are many ways to change the database’s parameters, other than just editing configuration files and restarting the server. Understanding the context of the parameters can help to reduce server downtime when doing configuration changes. It helps also to know when changes take effect.
Every configuration setting has an associated context in which it’s allowed to be changed. Asking the database is the best way to find the context of parameters. The following query shows a snippet of the result:
test=# select name,context from pg_settings;
                  name                  |      context
----------------------------------------+-------------------
...
 autovacuum_analyze_threshold           | sighup
 autovacuum_freeze_max_age              | postmaster
 autovacuum_max_workers                 | postmaster
 autovacuum_multixact_freeze_max_age    | postmaster
...
 backend_flush_after                    | user
 backslash_quote                        | user
 bgwriter_delay                         | sighup
 bgwriter_flush_after                   | sighup
 bgwriter_lru_maxpages                  | sighup
 bgwriter_lru_multiplier                | sighup
 block_size                             | internal
...
 commit_delay                           | superuser
...
From the hardest to easiest to change, we have the following settings: internal, postmaster, sighup, backend, superuser, user. To see the changes we need to recompile the server for internal, fully restart the server for postmaster, kill the process for sighup and restart the session for backend.
Server-side settings
maintainance_work_mem
A few larger operations such as VACUUM, CREATE INDEX and ADD FOREIGN KEY need dedicated working memory. All can allocate up to maintainance_work_mem worth of memory.
Since it’s unlikely that many sessions will be doing one of these operations at once, it’s fine to set this value much higher than the standard per-client work_mem setting. Still, there can be processes such as AUTOVACUUM which can spawn workers in parallel. So consider those sessions when setting this value. Assuming you haven’t increased the number of autovacuum workers too much, a typical setting for this value on a server would be at five percent of the total RAM. Therefore, even five such processes wouldn’t exceed a quarter of available memory.
default_statistics_target
PostgreSQL makes decisions about how to execute queries based on statistics collected about each table in your database. PostgreSQL collects this information by analyzing the tables, either with the ANALYZE statement or via autovacuum doing that step. In either case, the amount of information collected during the analyze step is set by default_statistics_target. Increasing this value makes analysis take longer, and as analysis of autovacuum happens regularly this turns into increased background overhead for database maintenance. But if there aren’t enough statistics about a table, you can get bad plans for queries against it.
For this reason, you might want to set better statistics just for a particular column in a table. You can use ALTER TABLE SET STATISTICS on that column to adjust this setting just for it. This is a better approach than increasing the system-wide setting and making every table pay for that requirement. Typically, the columns that really require a lot more statistics to work correctly will require a setting near 1000 to get a serious behavior change. This value is far higher than you’d want to collect data for on every table in the database.
If EXPLAIN ANALYZE for a query shows a significant variation between the actual and estimates, we should consider increasing the statistics target.
WAL settings
The documentation on wal_buffers suggests that the default is sufficient as long as no single transaction exceeds that value. However, in practice, write-heavy benchmarks see optimal performance at higher values. The default setting ranges from 64 KB to 16 MB. Setting this value to at least a few megabytes can improve write performance on a busy server where many clients are committing at once. Similarly, the auto-tuning selected by the default setting of -1 should give reasonable results in most cases.
The only downside is increased shared memory and given modern server memory sizes the normal thing to do nowadays is to just set:
wal_buffers = 16MB effective_cache_size
This value tells PostgreSQL approximately how much memory is available for all cache purposes (shared_buffers, filesystem cache, etc.). Unlike shared_buffers, this memory is not allocated. The query planner uses this value for estimation purposes. Concurrent queries will share the available space. The default setting of 128 MB can be too low in most cases, as is the case with shared_buffers. Let’s see the impact of this value on PostgreSQL’s estimates:
test=# CREATE TABLE test_cache (id int);
CREATE TABLE

test=# INSERT INTO test_cache SELECT generate_series(1,1000000);
INSERT 0 1000000

test=# CREATE INDEX idx_test_cache ON test_cache(id);
CREATE INDEX

test=# SET effective_cache_size='1 MB';
SET


test=# EXPLAIN SELECT * FROM test_cache ORDER BY id LIMIT 20;
                                              QUERY PLAN
------------------------------------------------------------------------------------------------------
 Limit  (cost=0.42..79.52 rows=20 width=4)
   ->  Index Only Scan using idx_test_cache on test_cache  (cost=0.42..3954572.42 rows=1000000 width=4)
(2 rows)

test=# SET effective_cache_size=‘4096 MB';
SET


test=# EXPLAIN SELECT * FROM test_cache ORDER BY id LIMIT 20;
                                              QUERY PLAN
------------------------------------------------------------------------------------------------------
 Limit  (cost=0.42..1.03 rows=20 width=4)
   ->  Index Only Scan using idx_test_cache on test_cache  (cost=0.42..30408.42 rows=1000000 width=4)
(2 rows)
Note the cost numbers PostgreSQL estimates for the two cases. If we increase the effective_cache_size then the numbers will go down significantly. Now, PostgreSQL estimates that it costs much less to retrieve the data. This example proves that effective_cache_size has an impact on the cost estimate. However, when we actually execute the query, there might not be any difference between the two cases shown.
Let’s see why this parameter has an impact. When we increase the effective_ cache_size, the planner assumes that more pages will fit in memory. This makes using indexes better than sequential scans. If the setting is too low, PostgreSQL might decide that sequential scans will be efficient. In short, a high setting increases the likelihood of the use of indexes. In contrast, a low setting increases the chances of sequential scans.
The same rough rule of thumb that would put shared_buffers at 25 percent of system memory would set effective_cache_size to between 50 and 75 percent of RAM.
Client-side settings
work_mem
Imagine you have to run a query that sorts data. The database has to estimate how much data is involved and then compares it to the work_mem parameter. If it’s larger (and the default is only 4MB), rather than sorting in memory it will use a disk-based sort instead. This is way slower than a memory-based one. Accordingly, if you regularly sort data, and have memory to spare, a large increase in work_mem can be one of the most effective ways to speed up your server. For example, a data warehousing report server might run with a gigabyte of work_mem.
This parameter is client-based. Therefore, we can keep the default to a moderate value, and only increase sort memory for the clients that you know are running large reports.
New server tuning
There are a few ways to combine all of this information into a process for tuning a new server.
Guideline for new server
- Adjust the logging default to be more verbose. The default values in the server configuration file are very low.
- Determine how large to set shared_buffers to. Start at 25 percent of system memory. Considering adjusting upward if you’re on a recent PostgreSQL version with spread checkpoints and know your workload benefits from giving memory directory to the buffer cache.
- Estimate your maximum connections generously, as this is a hard limit. Clients won’t be able to connect if the threshold is reached. Each connection uses a small amount of shared memory. However, each client can allocate memory for operation such as sorting and thus there is a potential for excess resource requirements.
- Start the server with these initial parameters. Check how much memory is still available for the OS filesystem cache using free or top commands on Linux systems.
- Adjust effective_cache_size based on shared_buffers plus the OS cache.
- Divide the OS cache size by max_connections, then by two. This gives you an idea of a maximum reasonable setting for work_mem. If your application is not dependent on sort performance, a much lower value than that would be more appropriate.
- Set maintenance_work_mem to around 5% of RAM.
- If you’re using a platform where the default wal_sync_method is unsafe, change it to one that is.
- Increase wal_buffers to 16 MB.
- Consider increases to both default_statistics_target (to 100, the modern default) and max_fsm_pages based on what you know about the database workload.
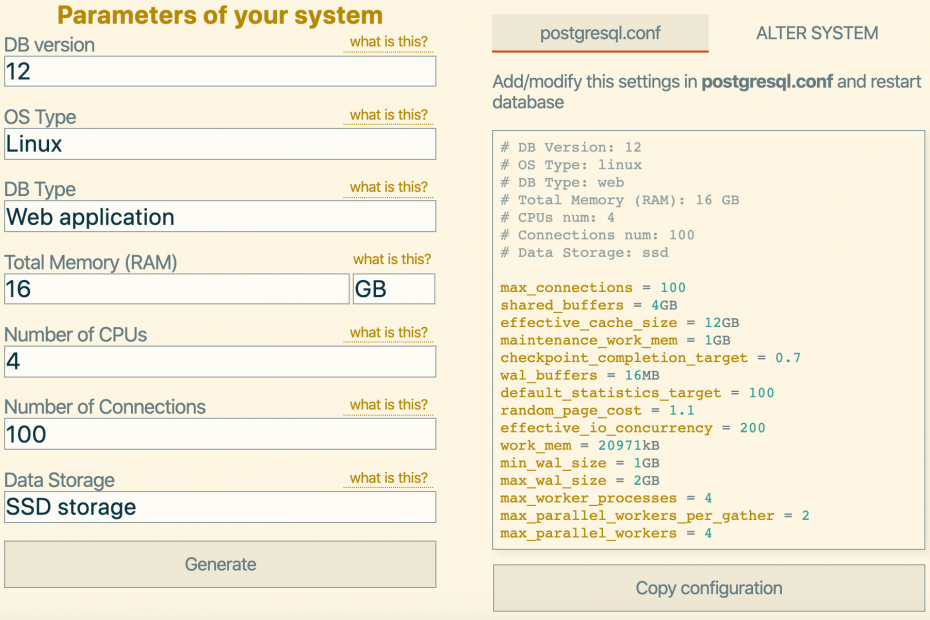
pgtune
Tiu can use pgtune program to create an initial postgresql.conf file for a new server. It allows you to suggest what the intended type of workload is, ranging from online analytical processing (OLAP) to online transactional processing (OLTP) and so on. Based on that input and system parameters like the amount of RAM in the server, it produces a tuned configuration for the major system parameters following similar methods to those described in this section. This is not going to be as accurate as following the guidelines for a dedicated server and measuring everything yourself, but it will get you up and running with a configuration that’s in the right general size very quickly. Any reasonably sized postgresql.conf should easily outperform the default one, as that’s optimized only for low shared memory use.
Conclusions
We looked at a number of parameters that influence the execution plan and thus have an impact on execution times. There are almost 200 values you might adjust in a PostgreSQL database’s configuration. The guidelines here should get you into the general area where you should start and give you an idea of what settings are more likely to be valuable when you do run into trouble.
So beneficial, look forwards to coming back.
Wow cuz this is really excellent work! Congrats and keep it up.