Key takeaways
- PostgreSQL allocation for the default shared_buffers is extremely low and we need to increase it to allow proper shared memory size for the database.
- shared_buffers works in cooperation with operating system cache, rather than replacing it and we should size it as only a moderate percentage of total RAM.
- Checkpoints need to be set carefully to limit crash recovery time, while not impacting the rest of the system’s performance.
- If you want to do better than allocating a percentage to the shared_buffers relative to the OS cache, you need to analyze the buffers cache content
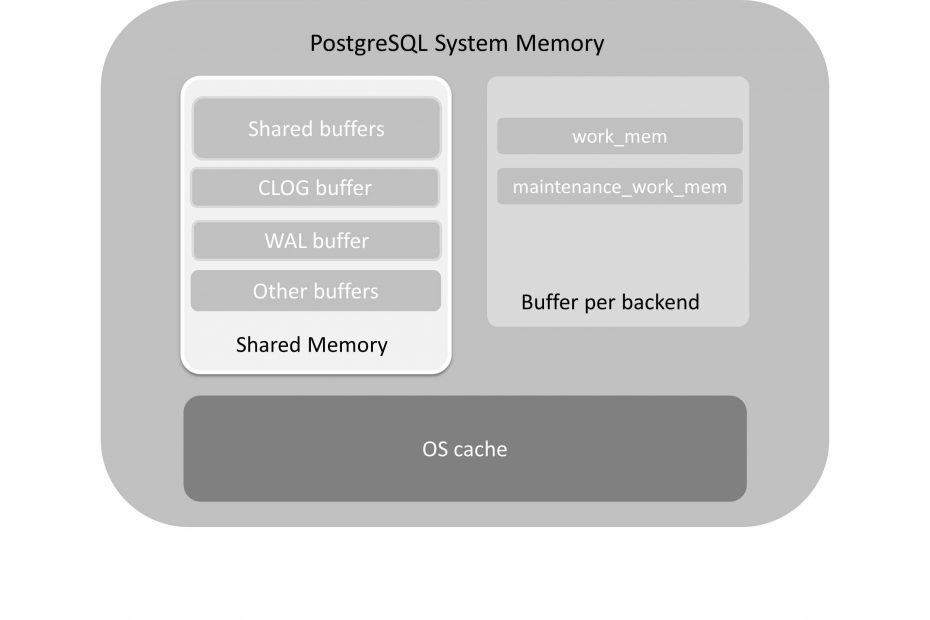
PostgreSQL System Memory
The default memory sizes of shared_buffers found in the postgresql.conf are not optimized for performance for any kind of typical configuration. They are optimized solely so that the server can start on a system with low settings.
When we talked about PostgreSQL Architecture we saw that when we start a Postgres server, it allocates a fixed-size block of shared memory. All-access to the information in the database will pass through this shared memory. In addition, each client that connects to Postgres will use it’s own bit of memory, expanding it as the client uses resources such as sorting space and storing data about pending transactions to commit.
The PostgreSQL shared_buffers is the major component of the shared memory used by the server. It is a large block allocated for caching blocks when reading from and writing to the database. This is set by a parameter named, surprise, shared_buffers. The main topic of this section is how this memory is used and how to optimize it. It is one of the most important parameters to get good performance, and one of the hardest to predict an optimum value for.
The clients can adjust some settings in the database after they connect. For example, the work_mem setting. This parameter is a limiter on how much memory can be used for sorting. The client can increase it after he connects. These allocations use the non-shared memory, so we are going to talk about it in this section.
Understanding the shared buffer
Reducing physical I/O
When there are thousands of users trying to read and write data to many different tables, reading from the directories and files will result in a miserably non-scalable system. The reads and writes will result in searching for many files, opening these files, using fseek() for specific data records. Locking, editing, and unlocking. To make this a lot more scalable and faster, the concept of sharedbuffers is introduced. Now, the backend processes are no longer reading from the files and writing to the files, but dealing with buffers or RAM, with significant improvement in performance. The amount of memory to be allocated is decided by the shared_buffers parameter in postgresql.config. This fixed-size block of shared memory is allocated when the server is started.
Caches
It’s not this memory chunk alone that is responsible for improving the response times, but the OS cache also helps quite a bit by keeping a lot of data ready-to-serve. Together, these two caches result in a significant reduction in the actual number of physical reads and writes. In addition to these two levels of caching, there could be a disk controller cache, a disk drive cache, and so on. The bottom line is that these caches improve performance by reducing the necessary physical I/O.
There are also risks associated with huge caches, such as the spikes in I/O. For example when large volumes of data get flushed from the buffer to disk.
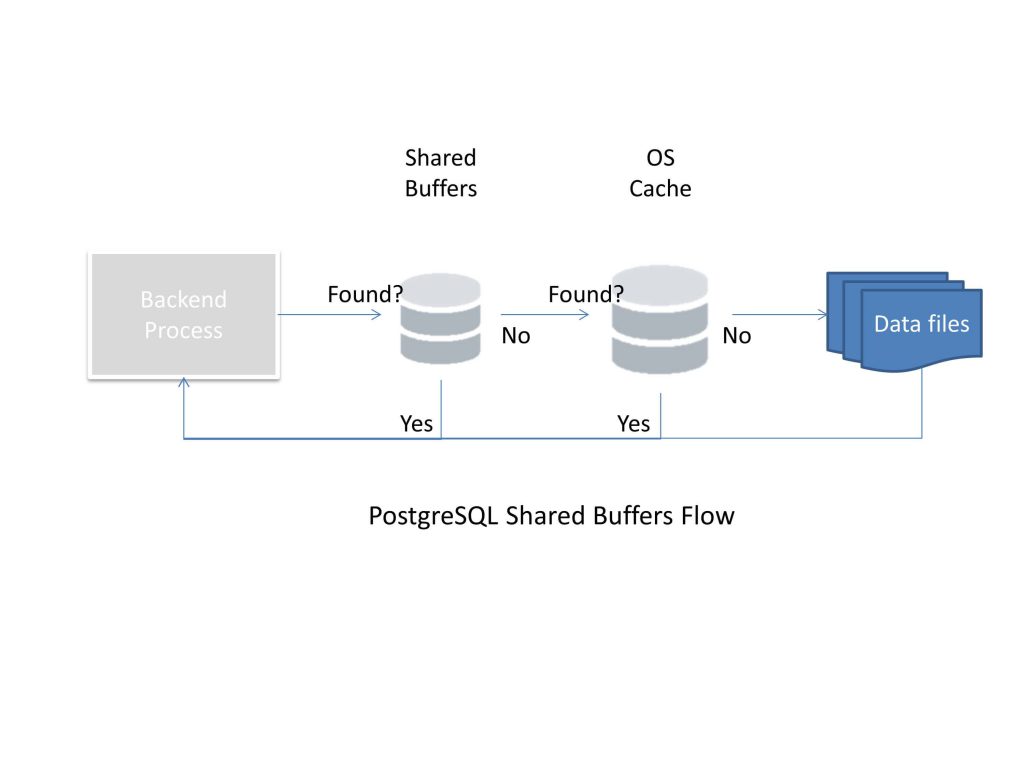
Route of a simple SELECT
Let’s just consider the possible routes a simple SELECT statement might take, considering the shared buffer cache and OS cache alone.
First, the process will check whether the data it wants is available in the database buffer cache. Second, if it is not available in the database buffer cache, a request goes to the OS to fetch the specific file or block. There is a chance that the OS cache already has the block and passes it to the database cache. In both of these cases, a physical I/O is avoided. Finally, it’s only when the data is not present in either of these caches (or other caches) when a user read or write will really result in a physical I/O. These three possibilities are shown in the following diagram:
It’s evident that most of the user-driven data reads and writes will happen via buffers. Exceptions to this would be databases where the buffer is tiny compared to the data that is usually read and written. Even in cases where the number of transactions per second is very high, the physical I/O will be limited if these transactions are mostly working with the same datasets. It’s only when different transactions are accessing data from really different areas in the file system that the issue of frequent buffer flushes to disk and reads from disk will occur.
Even in a scenario where a user makes a lot of changes to the database, it might not immediately result in writes to the underlying data files. This might just result in synchronization between Write Ahead Log files and the WAL buffer.
How data changed by users finally reaches the data files
To understand this, let’s discuss blocks or pages. Blocks or pages are the same thing. PostgreSQL always reads and writes data in blocks. Consider a table that has just one record. We have the value 1 in the column id, and the value “Bob” in the column first_name. The data in this record should add up to a few bytes. However, this table will consume 8 kilobytes in the disk because PostgreSQL works with 8 kilobytes blocks.
PostgreSQL shared_buffers versus operating system cache
If you’re used to a database where most system RAM is given to the database and the OS cache is bypassed using approaches like synchronous and direct writes, you don’t want to setup PostgreSQL that same way. It will be counterproductive in some areas. For example, PostgreSQL’s stores commit log information in the pg_clog directory. This data is read and written regularly, therefore it’s assumed that the operating system will take care of optimizing that access.
So why not just give all the RAM to the OS? The main reason that the PostgreSQL shared buffer cache can do better than the operating system cache is the way it keeps a usage count of buffers. This allows buffers to get a “popularity” score from 0 to 5, and the higher the score the less likely it is those buffers will leave the cache. Whenever the database is looking for something to evict to make more space for data it needs, it decreases that usage count.
Every increase in usage count makes that block harder to get rid of. This implementation is called the clock-sweep algorithm.
Typical operating system caches will only give any buffer one or two chances before that data is evicted. Usually, the OS will use some form of LRU algorithm. If your database has data in it that is used frequently it’s likely that data is being served better staying in the database’s shared RAM than in the operating system’s.
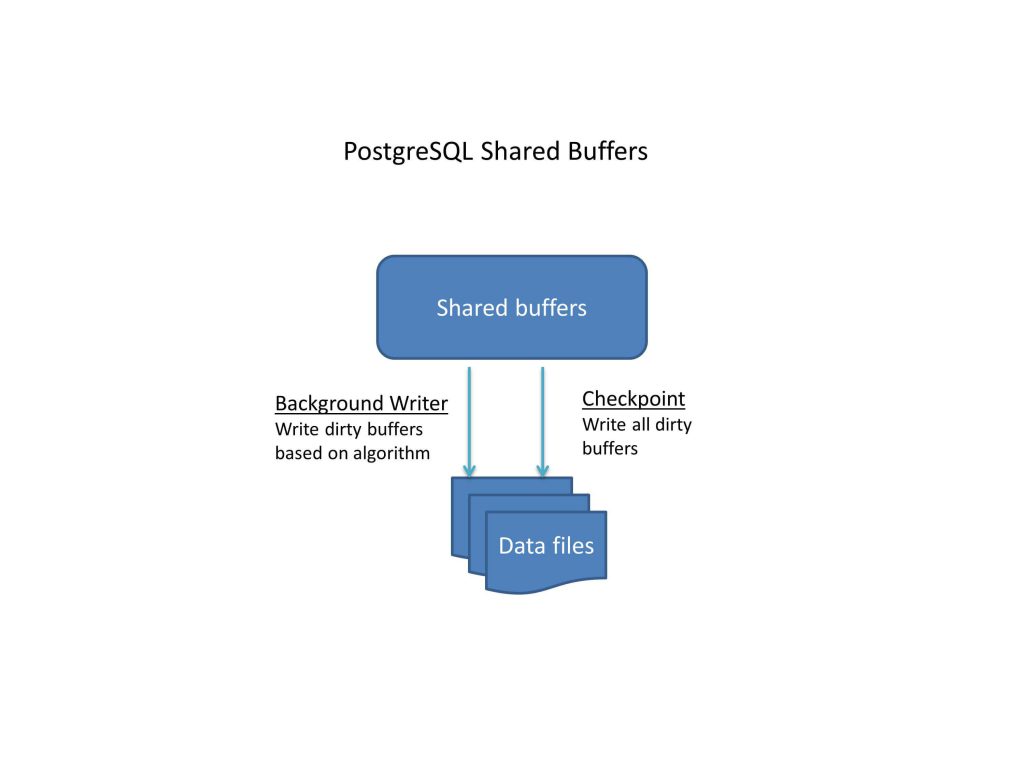
Checkpoint timing
When a user makes changes to the data, it first goes through the buffer. Now that buffer is dirty. As mentioned earlier, the fact that a user has committed a change does not mean that the modification has been written to the data file. The checkpointer process is responsible to write the change to the data file. When a checkpoint happens, all dirty pages are written to the table and index files. The process also marks the pages as clean. It also marks the write-ahead log as applied up to this point.
Basic processing flow
Checkpoints are points in the sequence of transactions at which it is guaranteed that all information written before this checkpoint has been updated. At checkpoint time, Postgres flushes to disk all dirty data pages. Then Postgres writes a special checkpoint record to the log file. In the event of a crash, the recovery procedure looks at the latest checkpoint record to determine the point in the log (known as the redo record) from which it should start the REDO operation. Any changes made to data files before this point are guaranteed to be already on disk. Hence, after a checkpoint, log segments preceding the one containing the redo record are no longer needed and can be recycled or removed.
This begs the question: when does a checkpoint happen? To some extent, we decide this. There are a few parameters that decide when a checkpoint should happen: checkpoint_segments, checkpoint_timeout, and checkpoint_completion_target.
The first one is checkpoint_segments. The default value for this is 3. A checkpoint occurs when 3 WAL segments have been filled. Each WAL segment is 16 MB.
The second parameter, checkpoint_timeout. A checkpoint occurs when the time period specified has elapsed.
Spread checkpoints
Let’s consider a server with around 16 GB shared buffer. This server has a significant load. If a large proportion of this load consists of writes, then, most of this 16 GB buffer can become dirty in a few minutes. A low setting for checkpoint_segments will result in frequent checkpoints. Similarly, a low setting for checkpoint_timeout will also result in frequent checkpoints. This results in excessive use of disk. On the other hand, if we keep these values very high, this will result in infrequent checkpoints. But in the case of a write-heavy system, this can result in significant I/O spikes during checkpoints, which affects the performance of other queries. We can tweak another parameter, checkpoint_completion_target, to alleviate this to some extent.
This parameter tells PostgreSQL how quickly it must try and finish the checkpointing process in each iteration. With the default value of 0.5, PostgreSQL will complete each checkpoint in about half the time before the next checkpoint starts. When we increase this value to, say 0.9, the writes resulting from the checkpoint get spread over a longer period. So, the I/O spikes get flattened out.
Crash recovery and the buffer cache
One issue with very infrequent checkpoints and a lot of dirty buffers is that time to recover might go up. In the case of a database crash, Postgres finds out the last checkpoint information. It will then replay all the transactions that happened after the last checkpoint and until the last commit. The transactions are read from the WAL files. If the volume of dirty data was large when the system went down, this means a significant number of transactions has to be replayed. This implies a higher downtime. From this angle too, it is better to have more frequent checkpoints rather than infrequent checkpoints. The time to recover might be as high as the checkpoint_timeout value.
Analyzing PostgreSQL shared_buffers contents
You’ve seen how using a block will increase its usage count. You’ve also seen how a dirty block makes its way out to disk. This wasn’t intended just as an academic knowledge. Believe it or not, all of this information is useful for determining how large your shared buffer cache should be!
If you want to do better than following a rule of thumb for how big to set PostgreSQL shared_buffers relative to the OS cache, you have two options. You can run your own benchmarks with your application and see how the results vary. Or in contrast, you can use the knowledge of how the buffer cache works from inside in order to help make that decision.
$ createdb -U postgres pgbench
$ pgbench -U postgres -i -s 50 pgbench
This will initialize (-i) the pgbench tables using a scale of 50 (-s 50) into the database named pgbench.
PostgreSQL ships with a benchmarking program named pgbench that can be used for a variety of tests. This benchmark models a simple bank application that includes a set of bank branches, each of which has some number of tellers and accounts.
Also, the number of scales is defined in the database as the number of branches, with each branch adding another 10 tellers and 100,000 accounts to the database.
Using this command we will create a database with a size greater than the shared buffer cache can hold. Therefore, we are forcing some prioritization, via the usagecount mechanism, of what is and isn’t kept in the PostgreSQL shared_buffers.
After database creation, we run some queries against the accounts table by using pgbench. In this case, 8 clients doing only reads from the accounts table, the largest in the database.
$ pgbench -U postgres -S -c 8 -t 25000 pgbenchGetting the largest relations in the cache
The following example appears in the documentation as an example of how to use pg_buffercache, and it’s quite a good way to start your analysis:
SELECT
  c.relname,
  count(*) AS buffers
FROM pg_class c
  INNER JOIN pg_buffercache b
    ON b.relfilenode=c.relfilenode
  INNER JOIN pg_database d
    ON (b.reldatabase=d.oid AND d.datname=current_database())
GROUP BY c.relname
ORDER BY 2 DESC
LIMIT 10;
We can see that almost all of the cache is being used by the pgbench_accounts table and the index defined for its primary key.
             relname             | buffers
---------------------------------+---------
pgbench_accounts                 |    8963
pgbench_accounts_pkey            |    7141
Buffer content summary
This query is where you probably want to start when analyzing a database. You can quickly see how much data is being cached for each table, and also how much that represents relative to its total size:
SELECT
  c.relname,
  pg_size_pretty(count(*) * 8192) as buffered,
  round(100.0 * count(*) /
    (SELECT setting FROM pg_settings
      WHERE name='shared_buffers')::integer,1)
    AS buffers_percent,
  round(100.0 * count(*) * 8192 /
    pg_table_size(c.oid),1)
    AS percent_of_relation
FROM pg_class c
  INNER JOIN pg_buffercache b
    ON b.relfilenode = c.relfilenode
  INNER JOIN pg_database d
    ON (b.reldatabase = d.oid AND d.datname = current_database())
GROUP BY c.oid,c.relname
ORDER BY 3 DESC
LIMIT 10;
Results with 128MB for shared_buffers:
      relname        |  buffered  | buffers_percent | percent_of_relation
-----------------------+------------+-----------------+---------------------
pgbench_accounts      | 71 MB      |            55.5 |                11.1
pgbench_accounts_pkey | 56 MB      |            43.6 |                52.1
Results with 256MB for shared_buffers:
   relname        |  buffered  | buffers_percent | percent_of_relation
-----------------------+------------+-----------------+---------------------
pgbench_accounts      | 158 MB     |            61.7 |                24.7
pgbench_accounts_pkey | 97 MB      |            37.8 |                90.2
Now, this is really useful. While pgbench_accounts_key is only using 37.8 percent of the cache, it’s holding onto 90 percent of the whole index. This tells us that the database considers that keeping that data in memory is really important. A breakdown of the usagecount data by relation will tells us why the database believes that.
Usage count distribution
This query shows usage counts by relation:
SELECT
 c.relname, count(*) AS buffers,usagecount
FROM pg_class c
 INNER JOIN pg_buffercache b
 ON b.relfilenode = c.relfilenode
 INNER JOIN pg_database d
 ON (b.reldatabase = d.oid AND d.datname = current_database())
GROUP BY c.relname,usagecount
ORDER BY c.relname,usagecount;
Results with 128MB for shared_buffers:
pgbench_accounts                 |    4347 |          0
pgbench_accounts                 |    4553 |          1
pgbench_accounts                 |     151 |          2
pgbench_accounts                 |       3 |          3
pgbench_accounts_pkey            |    2781 |          0
pgbench_accounts_pkey            |    3437 |          1
pgbench_accounts_pkey            |     757 |          2
pgbench_accounts_pkey            |     151 |          3
pgbench_accounts_pkey            |      25 |          4
pgbench_accounts_pkey            |      54 |          5
Results with 256MB for shared_buffers:
pgbench_accounts                 |    9348 |          0
pgbench_accounts                 |   10066 |          1
pgbench_accounts                 |     804 |          2
pgbench_accounts                 |      55 |          3
pgbench_accounts                 |       2 |          4
pgbench_accounts_pkey            |    1911 |          0
pgbench_accounts_pkey            |    3447 |          1
pgbench_accounts_pkey            |    2778 |          2
pgbench_accounts_pkey            |    2050 |          3
pgbench_accounts_pkey            |    1548 |          4
pgbench_accounts_pkey            |     641 |          5
Conclusion
Previous examples give you two basic things to look for when deciding if your PostgreSQL shared_buffers cache is large enough. First, check what percentage of the relations you consider as important to your application’s performance appear to be cached. If this number is low, you may benefit from a larger buffer cache.
The balance of popular (high usage count) versus transient (low usage count) pages tells you a lot about whether your cache is sized appropriately. If most of your pages have low usage counts (0,1), you can probably decrease the size of the buffer cache without a performance loss. When there aren’t popular pages to prioritize over transient ones then even the simplest operating system is capable of making good caching decisions.
But if you are accumulating a large number of blocks with a high usage count (4,5), this is strong evidence that your data is being served well from the shared buffer cache. Therefore your application might benefit from shared buffer cache to be even larger.