Key takeaways
- PostgreSQL is often shipped with a configuration that isn’t suitable for production. Due to this, you should at least configure the PostgreSQL buffer settings, the number of connections, and logging.
- The query planner needs to know about the memory situation and have good table statistics in order to make accurate plans.
- Checkpoints need to be tuned carefully in order to limit crash recovery time, while not impacting the rest of the system’s performance.
- The autovacuum process is also critical to make sure the query planner has the right information to work with, as well as to keep tables maintained properly.
Introduction
PostgreSQL is the world’s most advanced Open Source database. It is designed for extensibility and customization. It has ANSI/ISO compliant SQL support (strongly conforms to the ANSI-SQL:2008 standard specification). It has been actively developed for more than 25 years. Furthermore, it is well-known for its portability, reliability, scalability, and security.
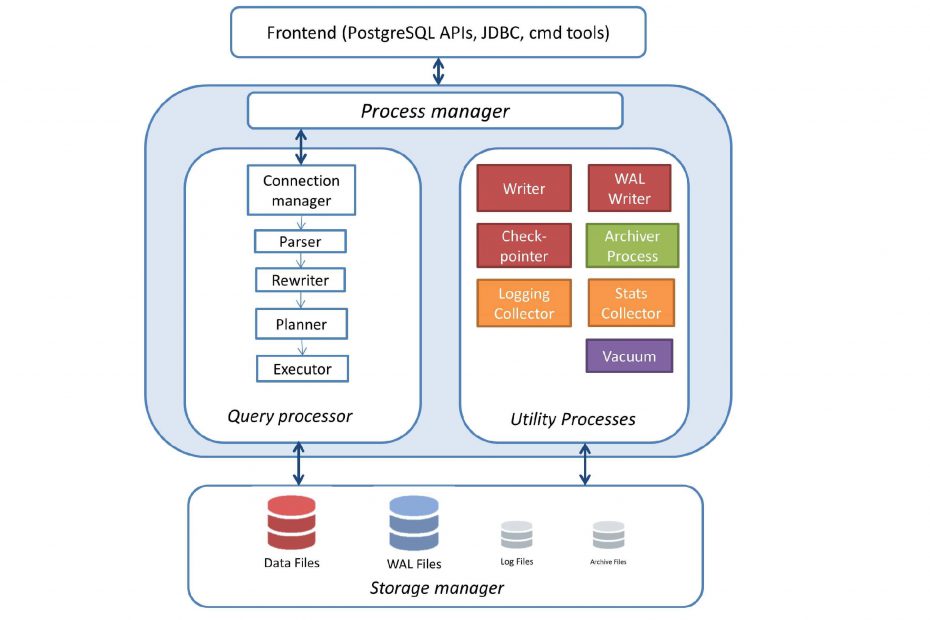
PostgreSQL uses the client-server model, where the client and server programs are usually on different hosts. The communication between the client and server is normally done via TCP/IP protocols or via Linux sockets.
Client process or program (frontend)
The database frontend application can perform any database action. The frontend can be a web server that wants to display a web page or a command-line tool that does maintenance tasks. PostgreSQL provides frontend tools such as psql, createdb, dropdb, and createuser and so on.
Server process (backend)
The server process manages database files, accepts connections from client applications, and performs actions on behalf of the client. The server process name is “postgres”. The main server process forks a new process for each new connection. Therefore, client and server processes communicate with each other without the intervention of the main server process. In addition, these new processes have a certain lifetime, which is determined by accepting and terminating a client connection.
The PostgreSQL server could be divided roughly into four subsystems, as follows:
- Process manager
- Query processor
- Utilities
- Storage Manager
Process manager
Starting with the daemon process
The first process that is launched when we start PostgreSQL is /usr/local/pgsql/bin/postgres. This process has quite a few responsibilities such as performing recovery, initializing shared data structures/memory space, and kicking off the mandatory and optional processes. These processes are also referred to as utility processes and include bgwriter, checkpointer, autovacuum launcher, log writer, stats collector process, and so on. Furthermore, the daemon process also listens for connection requests, receives requests for connections from clients, and spawns server processes for the client. It’s obvious that the daemon itself is a mandatory process that should be running in order for a user to connect to the database.
Backend Processes
Let’s focus on the user connecting-issuing-commands scenario. The following diagram walks you through the process of how the daemon process receives a connection request and starts (forks) a backend process. The backend process will, on successful authentication, start handling requests from that client:
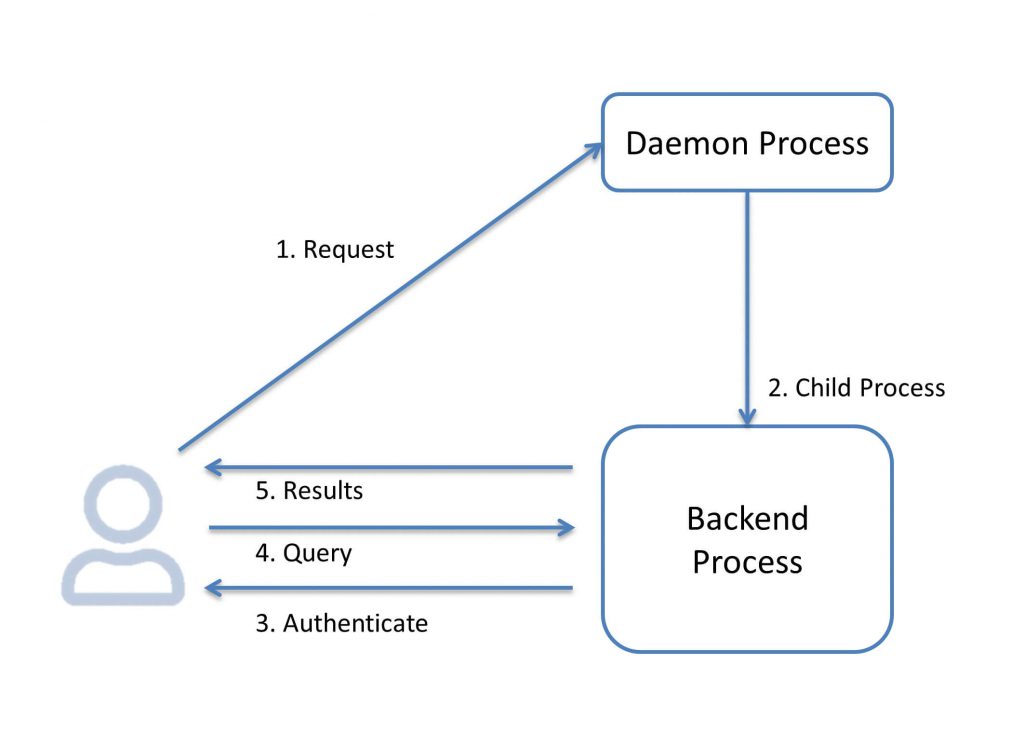
Similarly, the process is repeated for all connection requests (unless we hit the max_connections settings, in which case we get an error).
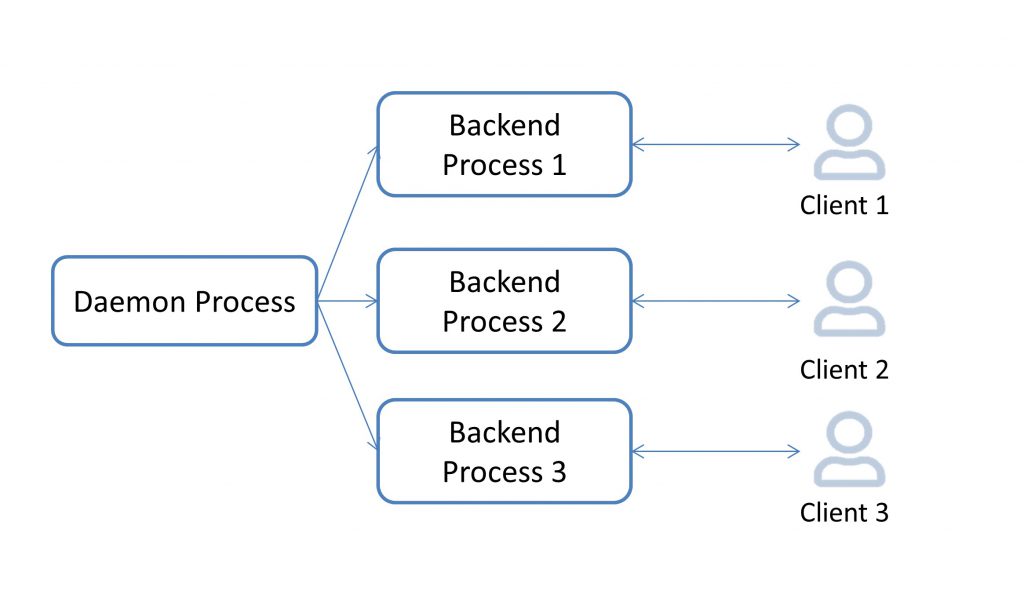
As a result, an active server, after a period of time, will have the processes that were there when the server started, plus quite a few processes to serve client connections, as shown in the following diagram:
Once a user is connected to a database, the user typically wants to read (SELECT) data or write (UPDATE/DELETE/INSERT) data, not to mention making changes to table structure, adding indexes, and so on.
However, when we consider that there might be thousands of users who want to do this, it gets a little bit more complex. Reading from the directories/files will result in a miserably non-scalable system. The reads and writes will result in searching for many files, opening these files, using fseek() for specific data records, locking, editing, and unlocking. To make this a lot more scalable and faster, the concept of shared buffers (memory area) is introduced. Now, the backend processes are no longer reading from the files and writing to the files, but dealing with buffers or RAM, with significant improvement in performance.
Query processor – The Path of a Query
Now let’s have a short overview of the stages a query has to pass in order to obtain the results.
- A connection from an application program to the PostgreSQL server has to be established.
- The parser stage checks the query transmitted by the application program for correct syntax and then creates a query tree.
- The rewrite system takes the query tree created at the parser stage and looks for any rules (stored in the system catalogs) to apply them to the query tree. It performs the transformations given in the rule bodies. One application of the rewrite system is in the creation of views. Whenever a query is executed against a view (i.e., a virtual table), the system rewrites the query in order to access base tables instead.
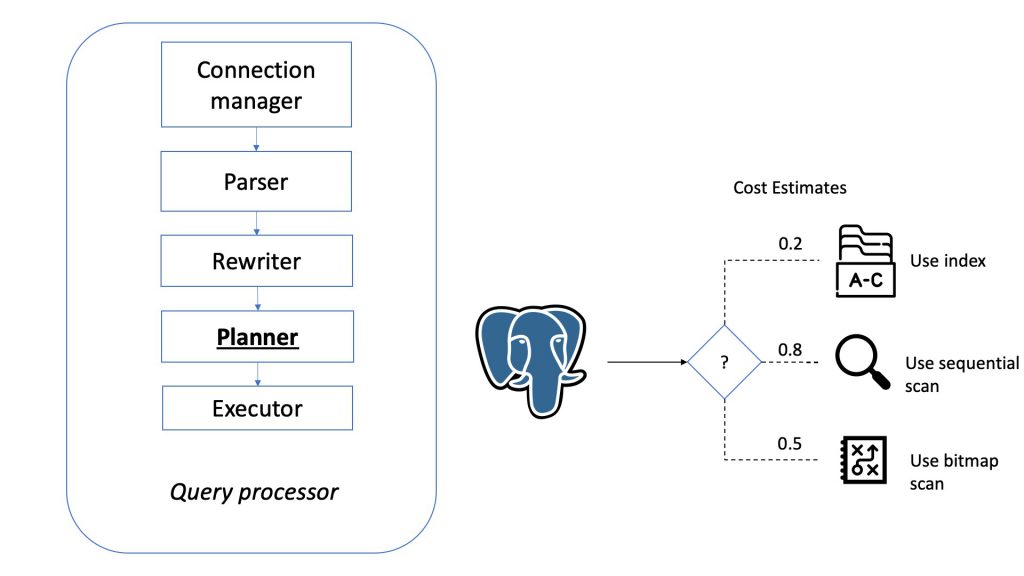
- The planner/optimizer takes the (rewritten) query tree and creates a query plan that will be the input to the executor. It does so by first creating all possible paths leading to the same result. For example, if there is an index on a relation to be scanned, there are two paths for the scan. One possibility is a simple sequential scan and the other possibility is to use the index. Next, the cost for the execution of each path is estimated and the cheapest path is chosen. The cheapest path is expanded into a complete plan that the executor can use.
- The executor recursively steps through the plan tree and retrieves rows in the way represented by the plan. The executor makes use of the storage system while scanning relations, performs sorts and joins, evaluates qualifications and finally hands back the rows.
Utility Processes
The utilities subsystem provides a means to maintain the database, such as claiming storage, updating statistics, and exporting and importing data with a certain format or logging.
With a default configuration, we will get the checkpointer process, the writer process, the WAL writer process, the autovacuum launcher process, and the stats collector process. You will see more processes running if you turn on archiving or streaming replication. You might also get a process for writing the server log, depending on the configuration.
The background writer
The background writer is responsible for writing to disk specific dirty buffers based on an algorithm, whereas checkpointer writes all dirty buffers. The process takes into consideration shared memory usage data as well as information about which blocks have been used/accessed recently (least recently used). The primary objective of this process is to ensure that free buffers are available for use.
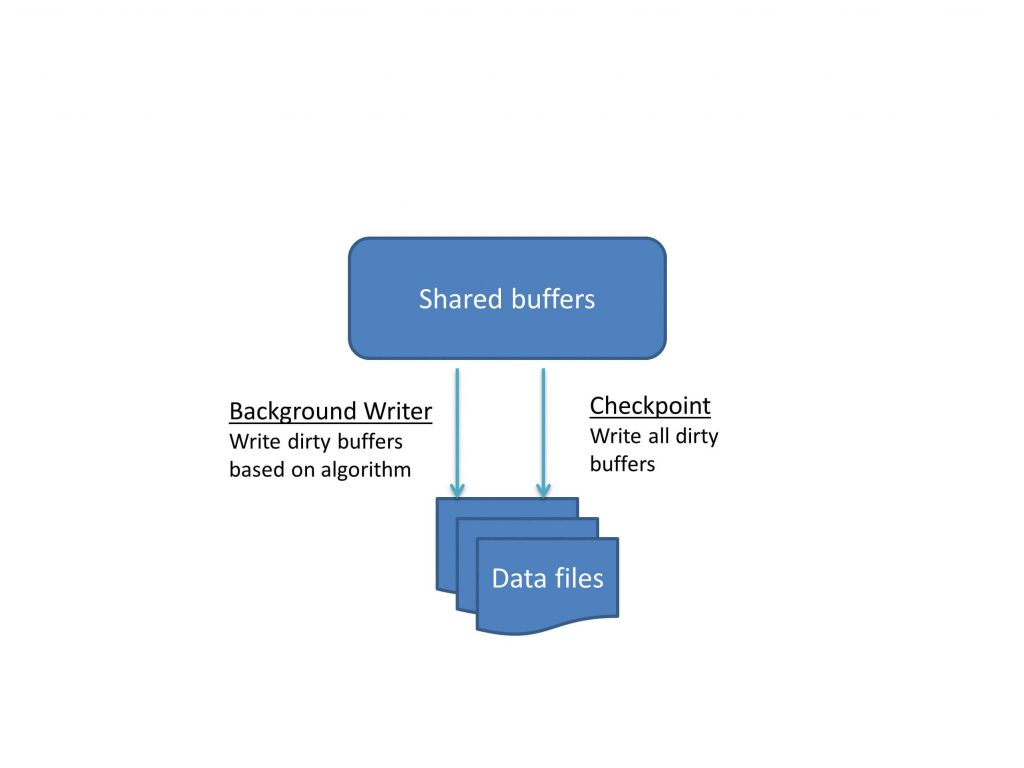
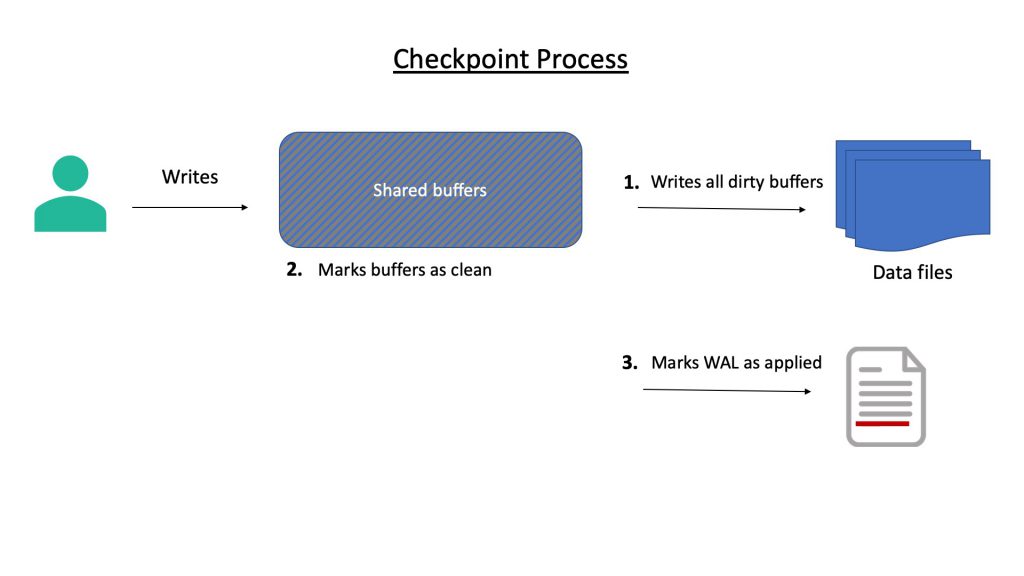
Checkpoint
Checkpoint is a mandatory process. Once a user makes changes to the data (which has been made available in the buffer), that buffer is dirty. The fact that a user has committed a change does not mean that the change has been written to the data file. It’s the job of the checkpointer process to write the change to the data file. The checkpointer writes all dirty (modified) pages to the table and index files. The process also marks the pages as clean. It also marks the write-ahead log as applied up to this point.
Let’s consider a server with around 16 GB shared buffer. If a significant proportion of this load consists of writes, then, most of this 16 GB buffer can become dirty in a few minutes. A low setting for checkpoint_segments will result in the available segments getting filled quickly and frequent checkpoints. Similarly, a low setting for checkpoint_timeout will also result in frequent checkpoints. This results in excessive disk throughput. On the other hand, if we keep these values very high, this will result in infrequent checkpoints. In a write-heavy system, this can result in significant I/O spikes during checkpoints, which affects the performance of other queries.
Wal writer
As mentioned before, when we make changes to the data, the changes are not written to the data files immediately. Postgres makes these changes to the blocks in the buffer and also writes them to the WAL buffer (as soon as changes to data are made). Changes are flushed to the WAL segments when the statements are committed.
Now, let’s also take a look at a few key parameters related to WAL. For example, the fsync setting forces each transaction to be written to the hard disk after each commit. Turning this off will increase performance, especially for bulk-upload operations. Disabling fsync can lead to serious problems, such as data consistency, in the case of power failure and crashes. A max_wal_size of a small value might lead to a performance penalty in write-heavy systems; on the other hand, increasing the max_wal_size setting to a high value will increase recovery time.
The autovacuum launcher process
This is an optional process that is ON as default value. The vacuum process marks space used by previously deleted (or updated) records as being available for reuse within the table. There is also a vacuum command to do this manually. Vacuum does not lock the table.
However, VACUUM FULL, in addition to marking the space as reusable, removes the deleted or updated records and reorders the table data. This requires an exclusive lock on the table.
Autovacuum automates the vacuum process. In cases where the database is under heavy load for the most part of the day, Postgres can scheduled vacuum during off-peak hours. Although even there are few or no deletes/updates in the cluster, it’s useful to have routine vacuuming as vacuum updates the data statistics used by the planner.
Stats collector
In short, the stats collector process keeps track of queries to tables and indexes. It does it for both disk-blocks and individual rows in order to output statistics of database activity. Keeping track of the statistics view will be useful in zooming in on tables that are frequently accessed, identifying columns to be indexed and can also help in providing input for configuring the server parameters (such as shared_buffers and other memory areas).
Archiever
The archiever process is responsible for copying files from the pg_xlog location to the archive location.
Logging collector
This is an optional process and the default setting is off. It is responsible for writing database messages into database log files. According to the level set in the configuration file, it writes into log files.
log_min_duration_statement = 0This setting causes the duration of each completed statement to be logged if the statement ran for at least the specified number of milliseconds. The default value is -1, which disables the logging feature. Setting the value to 0 results in the duration of all statements to be logged. This approach, along with an analysis tool such as pgbadger, helps in tracking down slow queries quickly. However, in a system with hundreds of queries executed every second, this setting can result in log files growing pretty quickly. So, it is better to have a process in place to move the log files to another location, where a tool such as pgbadger can be used to mine the log files and generate user-friendly reports.
Storage manager
The storage handles the memory cache, disk buffers, and storage allocation.
Summary
In this section, we covered the important processes and memory structures in PostgreSQL. We also saw how some configuration settings can effectively be used to capture data about the activities in the server, and then use this data to further optimize the database performance.
In the next part, we will give you an idea of what memory-related configurations you could make to improve that PostgreSQL performance.
Bibliography
- PostgreSQL 12 Official Documentation, https://www.postgresql.org/docs/
- PostgreSQL for Data Architects, Jayadevan Maymala, Packt Publishing, March 2015
- PostgreSQL 10 High Performance, Enrico Pirozzi, Gregory Smith, Ibrar Ahmed, April 2018
- Learning PostgreSQL 11, Andrey Volkov, Salahaldin Juba, January 2019